How Much Does a Vending Machine Make? Profit Data
Self-employed vending machine operators averaged $33,785 in yearly receipts in the Census Bureau’s latest figures. Here is how that varies by state, and what a new business can expect to keep.
Project your own vending machine businessFree numbers first · $49 for the full planThe national picture
Vending businesses with employees average $2,498,200 a year, but that category includes large vending and micro-market operators; self-employed figures are the better guide for a new operator.
Average receipts by state
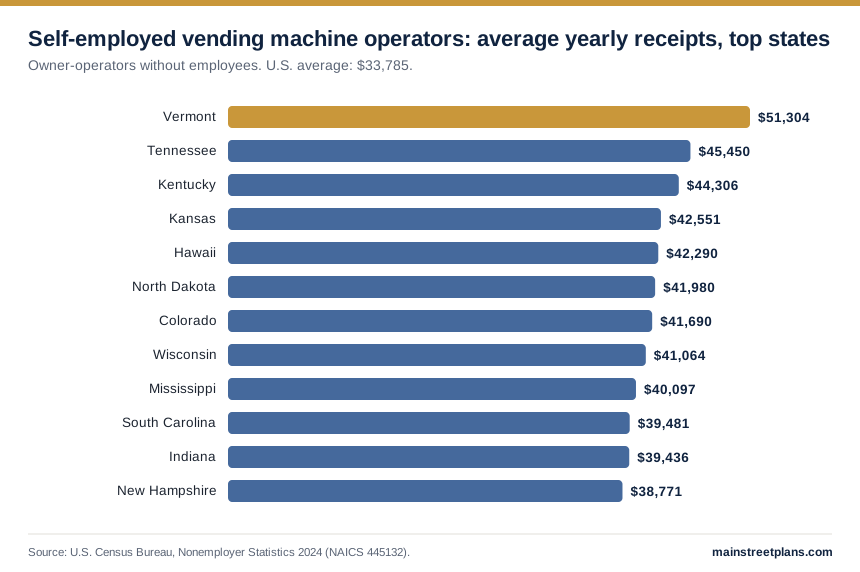
| State | Self-employed avg. |
|---|---|
| 1. Vermont | $51,304 |
| 2. Tennessee | $45,450 |
| 3. Kentucky | $44,306 |
| 4. Kansas | $42,551 |
| 5. Hawaii | $42,290 |
| 6. North Dakota | $41,980 |
| 7. Colorado | $41,690 |
| 8. Wisconsin | $41,064 |
| 9. Mississippi | $40,097 |
| 10. South Carolina | $39,481 |
| 11. Indiana | $39,436 |
| 12. New Hampshire | $38,771 |
| 13. Alabama | $38,103 |
| 14. Arizona | $37,967 |
| 15. Utah | $37,611 |
Show all 51 states
| 1. Vermont | $51,304 |
| 2. Tennessee | $45,450 |
| 3. Kentucky | $44,306 |
| 4. Kansas | $42,551 |
| 5. Hawaii | $42,290 |
| 6. North Dakota | $41,980 |
| 7. Colorado | $41,690 |
| 8. Wisconsin | $41,064 |
| 9. Mississippi | $40,097 |
| 10. South Carolina | $39,481 |
| 11. Indiana | $39,436 |
| 12. New Hampshire | $38,771 |
| 13. Alabama | $38,103 |
| 14. Arizona | $37,967 |
| 15. Utah | $37,611 |
| 16. Minnesota | $37,590 |
| 17. Idaho | $37,579 |
| 18. Connecticut | $37,563 |
| 19. Louisiana | $37,559 |
| 20. New Mexico | $37,459 |
| 21. Arkansas | $37,403 |
| 22. Missouri | $35,529 |
| 23. California | $34,760 |
| 24. Rhode Island | $34,519 |
| 25. Massachusetts | $34,473 |
| 26. Illinois | $34,456 |
| 27. North Carolina | $34,172 |
| 28. Oregon | $34,068 |
| 29. Oklahoma | $33,804 |
| 30. Nevada | $33,683 |
| 31. Texas | $33,297 |
| 32. Pennsylvania | $33,068 |
| 33. New Jersey | $32,746 |
| 34. Nebraska | $32,211 |
| 35. Ohio | $31,521 |
| 36. Washington | $31,509 |
| 37. Iowa | $31,415 |
| 38. Florida | $30,513 |
| 39. Georgia | $30,280 |
| 40. Maine | $30,055 |
| 41. Alaska | $29,774 |
| 42. New York | $28,731 |
| 43. Maryland | $28,525 |
| 44. Montana | $28,524 |
| 45. Michigan | $27,972 |
| 46. Virginia | $27,868 |
| 47. West Virginia | $27,654 |
| 48. Delaware | $23,344 |
| 49. Wyoming | $22,283 |
| 50. District of Columbia | $19,600 |
| 51. South Dakota | $19,224 |
States without a published figure are left out; the Census withholds numbers that could reveal individual businesses.
From sales to profit
Sales are not take-home pay. In our model with typical assumptions, costs that rise with sales take 60% of revenue before fixed costs and loan payments. A new vending machine business might look like this:
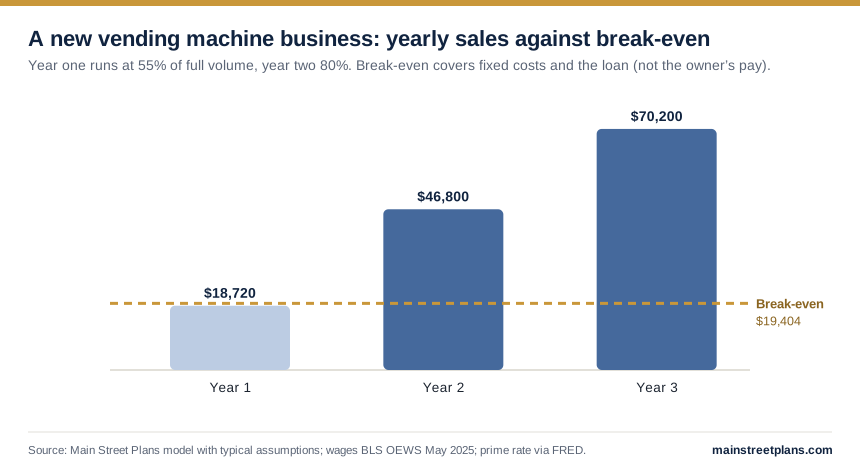
| Year 1 | Year 2 | Year 3 | |
|---|---|---|---|
| Sales | $18,720 | $46,800 | $70,200 |
| Operating profit (before owner pay) | $961 | $11,770 | $20,733 |
| Margin | 5.1% | 25.1% | 29.5% |
Your own numbers
Questions
How much profit does one vending machine make?
At $90 of sales a week, a machine takes in about $390 a month. After product, the location’s commission, card fees and its telemetry fee, about $146 a month is left to cover your vehicle, insurance and time. Busy locations sell far more than this starting assumption; quiet ones less.
How much do self-employed vending machine operators make?
Self-employed operators averaged $33,785 in yearly receipts in the Census Bureau’s 2024 Nonemployer Statistics; many run the business part time.
How much profit can a new one make?
In our example with typical assumptions, a new vending machine business reaches $70,200 in year-three sales and $20,733 in operating profit before the owner’s pay and income tax — a 29.5% margin. Your own prices and costs change that.
Related
Sources
- U.S. Census Bureau, County Business Patterns 2023 — NAICS 445132 (Vending Machine Operators).
- U.S. Census Bureau, 2022 Economic Census — receipts, payroll and employment.
- U.S. Census Bureau, Nonemployer Statistics 2024.
- U.S. Bureau of Labor Statistics, OEWS May 2025 — Coin, Vending, and Amusement Machine Servicers and Repairers.
- Federal Reserve, bank prime loan rate (via FRED).
Figures are computed by Main Street Plans from the published federal files listed above. See how we build our numbers.